



Few moments in routine parenting cause as much quiet anxiety as the pediatrician’s well-child visit. After height, weight, and head circumference are recorded, parents are handed a chart marked with jagged lines and percentiles. Hearing that an active, energetic child sits in the 15th percentile for weight or the 88th percentile for body mass index often triggers immediate concern. In a parenting landscape flooded with conflicting wellness advice, establishing clear context around developmental metrics is essential. Today, many families navigate early family health and administrative routines by turning to comprehensive parenting resources like Genesis Parent Portal to centralize practical tracking tools, milestone overviews, and daily guidance. To make sense of pediatric reports, however, parents must first understand what childhood body mass index actually measures—and what it leaves out.
Why Childhood BMI Differs from Adult Metrics
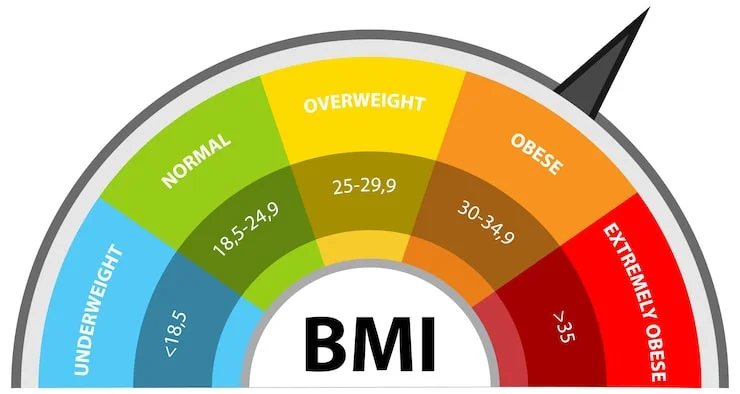
In adults, Body Mass Index (BMI) is calculated using a straightforward formula based strictly on height and weight. Because adult bodies have stopped growing, clinical categories such as underweight, normal, overweight, and obese remain fixed across static numerical ranges.
Applying this same rigid standard to growing children would be misleading. A child’s body composition fluctuates drastically as bones lengthen, muscle tissue develops, and fat distribution shifts across distinct growth phases. A toddler naturally holds a higher percentage of body fat than an active eight-year-old, and boys and girls develop lean mass along entirely different biological timelines.
For this reason, pediatric medicine evaluates children using BMI-for-age percentiles. Rather than comparing a child to an arbitrary numerical scale, their height and weight ratio is compared directly against national reference data for children of the exact same age and biological sex. These benchmarks, maintained by clinical authorities like the CDC, reflect established patterns across standard population curves.
Understanding the Percentile Spectrum
A percentile indicates where a child falls relative to a statistical cohort of 100 peers of identical age and gender:
- Underweight: Below the 5th percentile
- Healthy Weight: 5th percentile to just below the 85th percentile
- Overweight: 85th to just below the 95th percentile
- Obesity: 95th percentile or higher
A child sitting at the 60th percentile does not have a “failing grade” or a physical deficit; it simply indicates that their BMI is equal to or higher than 60% of children of the same age and sex in the reference population.
Pediatricians are rarely concerned with a single, isolated percentile number. Instead, the primary focus during annual wellness exams is growth velocity and curve consistency. A child who has tracked steadily along the 25th percentile since infancy is generally demonstrating healthy, genetic-aligned growth. In contrast, an abrupt jump from the 40th percentile to the 90th percentile over a six-month period warrants an open conversation regarding lifestyle, dietary adjustments, or underlying metabolic shifts.
Tracking Between Visits Without Obsessing
Because annual checkups are spaced twelve months apart once a child reaches early school age, parents often wonder how sudden growth spurts or appetite shifts affect overall development. Home monitoring can provide useful peace of mind, provided it is approached as an informational check rather than a daily obsession.
If your child has experienced a noticeable stretch in height or changes in their physical activity levels, using a reputable child BMI calculator allows you to input current measurements, view corresponding CDC-aligned percentiles, and observe where they sit along the standard growth curve. Checking metrics every four to six months helps parents identify gradual trends early, offering tangible data to bring to the next wellness visit rather than relying on guesswork.
When recording measurements at home, accuracy is critical. Measure your child barefoot against a flat wall using a firm, flat ruler laid across the crown of the head, and weigh them in light clothing in the morning before breakfast. Even slight errors in height measurement can distort calculated percentiles significantly.
Focusing on Habits Over Numbers
While growth percentiles serve as a helpful preliminary screening metric, they do not measure body composition, muscle density, bone structure, or athletic capability. A muscular child who plays soccer five days a week may register near the 85th percentile despite possessing exceptional cardiovascular endurance and minimal excess body fat.
Rather than placing undue pressure on numerical targets, pediatric health experts advocate focusing on sustainable, family-wide routines:
- Unprocessed, colorful nutrition: Prioritize whole grains, lean proteins, fruits, and vegetables over restrictive calorie counting or food labeling.
- Daily unstructured movement: Ensure at least 60 minutes of active play or physical activity daily.
- Consistent restorative sleep: Establish regular bedtime routines, as vital growth hormones are secreted primarily during deep sleep cycles.
- Open clinical communication: Treat percentiles as conversation starters with your pediatrician rather than definitive verdicts on your child’s overall wellness.
Navigating childhood growth metrics does not have to be a source of ongoing stress for parents. By understanding that percentiles are simply reference points along a broader developmental journey, families can shift their focus away from rigid numbers and toward sustainable, daily habits. Whether you are reviewing clinical charts during an annual checkup or monitoring periodic changes between visits, the primary objective is clear: supporting a vibrant, active environment where your child can thrive physically and confidently at their own unique pace.