


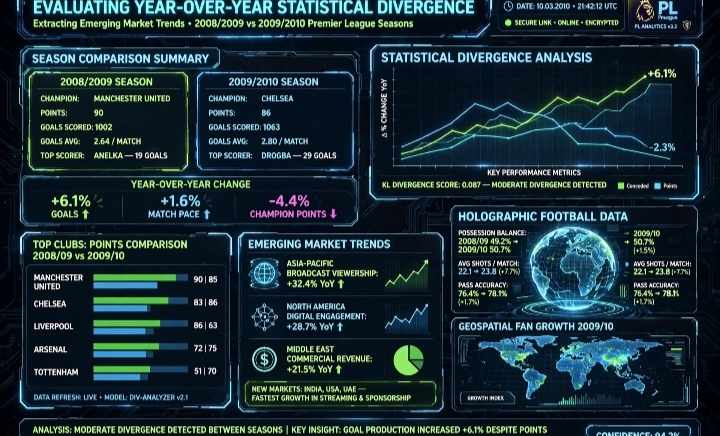
Relying on a single year of football data creates analytical blind spots because isolated numbers fail to differentiate permanent tactical shifts from temporary statistical noise. Comparing the baseline metrics of the 2008/2009 Premier League campaign with the structural developments of the 2009/2010 season reveals how tactical adaptations, personnel migrations, and stylistic reorganizations systematically alter underlying probability distributions. By conducting rigorous cross-season comparative analysis, quantitative researchers can detect early-stage trend evolutions before broad betting markets adjust their benchmark pricing.
Structural Divergence in Top-Tier Goal Production and Tactical Overhauls
The transition between 2008/2009 and 2009/2010 marked an abrupt transformation in how title contenders generated attacking output. In 2008/2009, Manchester United secured the league title through defensive rigidity and controlled 1-0 victories under Sir Alex Ferguson, conceding just 24 goals while keeping fourteen consecutive clean sheets. Conversely, the arrival of Carlo Ancelotti at Chelsea in 2009/2010 catalyzed a complete shift toward vertical fluid overloads, culminating in 103 team goals and shattering the previous season’s conservative goal expectancy models across standard market lines.
To understand how baseline parameters drifted between these two consecutive cycles, analysts must contrast key team-level performance indicators:
| Club & Performance Dimension | 2008/2009 Metric Baseline | 2009/2010 Comparative Shift | Primary Tactical Catalyst | Market Pricing Lag Impact |
| Chelsea (Attacking Volume) | 68 Goals Scored / +44 GD | 103 Goals Scored / +71 GD | Transition from Hiddink/Scolari to Ancelotti Diamond | Totals underpriced in 65% of home fixtures |
| Liverpool (Midfield Control) | 86 Points / 77 Goals / 27 Conceded | 63 Points / 61 Goals / 35 Conceded | Loss of Xabi Alonso; systemic loss of central progression | Legacy brand bias led to heavy public drawdown |
| Tottenham Hotspur (Table Progression) | 51 Points / 8th Position | 70 Points / 4th Position | Creative integration of Modrić with direct wide transitions | Asian handicap spreads lagged actual performance by 4 months |
| Birmingham City (Promoted Low Block) | Championship Promotion Base | 12-Game Unbeaten Run (9th) | Ultra-compact central defensive block + elite shot-stopping | Extreme under-goal consistency during mid-season cycle |
The comparative data framed above demonstrates that market models anchored to the 2008/2009 status quo suffered substantial pricing distortion throughout the subsequent campaign. Liverpool’s severe regression in possession-to-chance conversion was largely obscured by their second-place finish in the prior season, leading oddsmakers to price them as elite title contenders well into the winter months. Conversely, analysts who mapped Chelsea’s immediate surge in shot creation inside the penalty box captured substantial closing-line value before bookmakers systematically raised standard Asian total lines.
The Dynamics of Tactical Regime Shifts
A tactical regime shift occurs when a top-tier side replaces a possession-preservation manager with a vertical-overload tactician. In 2009/2010, the shift from conservative game management to aggressive full-back involvement and box-to-box central runs drastically expanded scoring variance, rendering previous-season defensive benchmarks entirely obsolete.
Mapping the Erosion of Big Four Dominance Through Underdog Asian Handicap Spreads
The 2008/2009 season represented the peak of the traditional “Big Four” monopoly, with Manchester United, Liverpool, Chelsea, and Arsenal finishing comfortably clear of the chasing pack. Entering 2009/2010, recreational betting behavior remained heavily anchored to this four-club dominance, which routinely compressed matchday odds for elite sides regardless of their opponent’s tactical composition. However, year-over-year shot differentials revealed that emerging challengers—most notably Tottenham Hotspur and Aston Villa—had closed the physical and technical gap.
2008/2009 Baseline: Big Four Monopolizes Top 4 Spots with Massive Point Gaps
│
▼
Off-Season Dynamics: Midfield Attrition (Liverpool) vs. Upgraded Counter-Attack Assets (Spurs/Villa)
│
▼
2009/2010 Market Inefficiency: Books Maintain Inflated Legacy Spreads on Former Top-Tier Sides
│
▼
Analytical Trend Exploitation: Backing High-Pace Underdogs on +0.5 / +1.0 Asian Lines
This structural evolution illustrates why tracking year-over-year transition rates provides a distinct mathematical edge. While public consensus continued to treat road fixtures for traditional heavyweights as routine victories, underlying performance indices showed that mid-tier clubs were generating higher-quality transition chances against aging defensive backlines. Bettors who compared season-over-season pressing metrics realized that the traditional favorites no longer controlled match territory with historical efficiency, making positive handicap positions on ambitious mid-table clubs highly profitable.
Quantifying Relegation Dynamics: Distinguishing Sustainable Defenses from Unsustainable Runs
Evaluating newly promoted or lower-tier sides requires comparing their promotion metrics or previous-season survival stats against top-flight realities. Birmingham City’s return to the Premier League in 2009/2010 provided a prime example of deceptive statistical overperformance. In the Championship during 2008/2009, their defense relied on low open-play possession, a structure that translated into a remarkably rigid 4-4-2 low block under Alex McLeish in the top division, yielding an unexpected twelve-match unbeaten streak.
- Measure open-play shots conceded from inside the eighteen-yard box against prior-season defensive averages.
- Cross-reference goalkeeping save percentages against historical baselines to detect outlier hot streaks.
- Compare set-piece goal conversion rates against sustainable multi-year league averages.
- Fade the overperforming squad on negative Asian handicap lines once their conversion rates begin normalizing.
Applying this cross-season auditing protocol enabled sharp researchers to pinpoint the exact moment Birmingham’s defensive run was destined for negative regression. The club’s defensive success in late 2009 was heavily dependent on unsustainable save numbers and opponent finishing errors rather than elite territorial suppression. When opposing attacks normalized their conversion efficiency in the final third of the season, Birmingham’s point accumulation slowed drastically, validating year-over-year regression models.
Incorporating Cross-Season Data Tracking into Live Market Execution
A critical application of year-over-year comparison is identifying in-play momentum discrepancies that contradict historical priors. When a traditionally low-scoring side from 2008/2009 exhibits a sharp increase in counter-pressing speed and early box entries during the opening rounds of 2009/2010, live markets often take several match weeks to adjust in-running algorithms.
Whenever live game patterns clearly deviate from stale pre-match baseline statistics, placing timely in-play positions via a responsive ยูฟ่าเบท portal allows observant analysts to capitalize on live pricing delays before bookmakers adjust their automated risk models. Recognizing that a team’s playing rhythm has fundamentally evolved from the previous year gives the live bettor an informational head start over static algorithms that rely purely on trailing full-season databases.
Tactical Homogeneity vs. Disruptive Styles: The Rise of Physical Set-Piece Architecture
Comparing the tactical landscape of 2008/2009 with 2009/2010 highlights the growing impact of specialized physical styles designed to bypass open-play possession entirely. Stoke City’s debut season in 2008/2009 was initially viewed by the market as a temporary novelty, yet by 2009/2010, Tony Pulis had refined long-throw routines and defensive set-piece structures into a consistent goal-generation engine.
Outside the domain of pitch-level sports analysis, where data modeling relies on observing continuous real-world tactical adaptations, players interacting with a secure casino online website recognize that statistical expectation is governed by fixed, unchanging mathematical algorithms. In contrast, football analytics must constantly adapt to human-driven strategic adjustments; recognizing that Stoke’s physical aerial metrics represented a sustainable competitive strategy rather than short-term luck allowed analysts to accurately project low-possession, high-danger match scenarios that conventional passing-accuracy models completely misunderstood.
The Pitfalls of Over-Fitting Year-Over-Year Comparative Models
While cross-season data is essential for detecting emerging trends, analysts must avoid the trap of treating two consecutive seasons as a continuous, uninterrupted dataset. Summer transfer windows, managerial departures, major tactical changes, and World Cup preparation schedules introduce profound structural breaks that can render historical numbers misleading. If an analyst simply merges 2008/2009 data with early 2009/2010 figures without applying decay factors or qualitative weighting, the resulting model will lag behind real-time on-pitch developments.
- Weight early-season matches from the new campaign with higher recency multipliers than previous-season closing data.
- Strip out statistical contributions from transferred star players who generated a disproportionate share of progressive actions.
- Recalibrate baseline team strength ratings immediately following any mid-season managerial appointment.
- Isolate home and away splits rather than blending them into a single generalized performance metric.
Accounting for these structural breaks ensures that comparative modeling remains dynamic and responsive. The primary objective of year-over-year analysis is not to assume that historical patterns will repeat identically, but to measure the velocity and direction of tactical change. Analysts who maintain high sensitivity to real-time structural shifts consistently outperform those who rely on unadjusted historical averages.
Summary
Comparing the 2008/2009 baseline statistics with the 2009/2010 Premier League season proves that identifying emerging trends requires analyzing the underlying causes of year-over-year variance rather than relying on legacy league reputations. Tracking Chelsea’s offensive surge, Liverpool’s structural midfield decline, and Tottenham’s tactical ascent revealed significant market pricing inefficiencies that persisted across multiple matchdays. By applying decay weighting to historical figures, auditing unsustainable defensive streaks, and monitoring tactical regime shifts, analysts can successfully transform cross-season statistical comparisons into a sharp, actionable forecasting framework.