



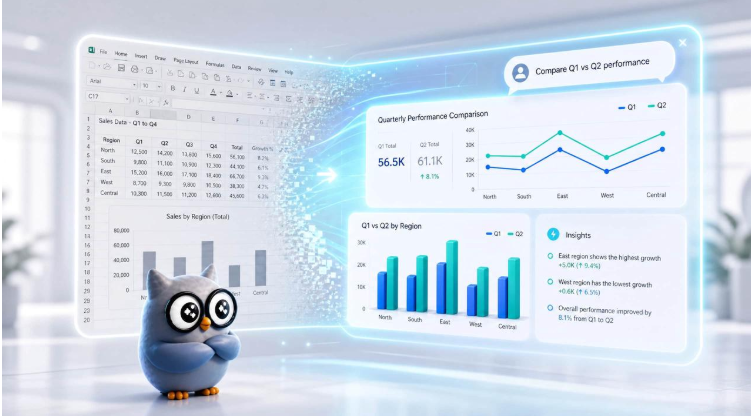
Spreadsheets have long been the default tool for tracking metrics and building business reports. But as teams deal with larger datasets and faster turnaround times, relying on manual, click-and-drag grid editors is becoming a major bottleneck. Instead of wasting time fighting with complex software layouts, forward-thinking teams are changing how they work. They are moving away from traditional menus and using simple, natural language prompts to turn raw data into clean visuals instantly.
Switching to a conversational chart gen ai workflow changes the entire reporting process. Platforms like chartgen.ai are proving that simply describing the chart you need in plain text is faster, easier, and far more efficient than building it manually row by row.
The Hidden Bottlenecks in Traditional Reporting Workflows
Traditional reporting workflows require continuous manual labor to construct even basic categorical breakdowns. This manual setup introduces major efficiency bottlenecks that drain employee productivity across different departments.
First, standard spreadsheet software creates heavy data transformation bottlenecks. Raw corporate exports inherently arrive with inconsistent data ranges, empty parameters, or format anomalies. Consequently, data analysts spend valuable hours cleaning rows and calculating percentages before any charting can begin. This repetitive preparation wastes valuable cognitive energy on tedious administrative tasks.
Second, legacy utilities lack automatic design intelligence. The built-in templates available in old spreadsheet applications look overly technical and uninspiring. To elevate a basic graphic to an executive standard, a user must execute dozens of manual adjustments. They must alter font sizes, fix clashing color schemes, and re-align labels by hand.
Third, manual cell dependencies introduce a high risk of formula fragility. Traditional graphics maintain a highly volatile relationship with underlying cells. If a team member accidentally shifts a tracking column or introduces a minor typo into a cell formula, the entire chart breaks. Troubleshooting these hidden errors creates a stressful review cycle that delays critical business decisions.
Technical Engineering of an Automated Visual Pipeline
A specialized browser-based application completely eliminates manual configuration and spreadsheet design troubleshooting. Operating as a full-stack automated rendering engine, a modern chart gen ai uses intelligent automation to streamline the entire visualization pipeline.
Natural Language Processing Execution
Rather than forcing users to act as graphic designers, a conversational system allows professionals to generate graphics by simply typing what they want to see. For example, an account manager can upload a CSV and type a simple request. The dynamic system processes this natural language query and generates the exact visual asset immediately. This chat-to-chart functionality bypasses complex setup steps entirely.
Instant Algorithmic Rendering
This natural language capability is the core operational advantage of chartgen.ai. The platform parses the dataset and instantly matches the user’s text prompt with the optimal visual framework. Users save hours of formatting time because the engine handles the structural layout, color contrast calculations, and data alignment automatically behind the scenes.
Dynamic Iteration and Editing
In a traditional spreadsheet, changing a chart type requires starting the process over from scratch. In contrast, a conversational chart gen ai allows for rapid iteration. If a user wants to change a bar chart into a pie chart, they simply type the new command into the chat interface. The system updates the graphic in real-time, providing unparalleled agility during crucial strategy meetings.
Democratizing Data Across Corporate Business Units
Adopting an agile, automated web tool delivers immense performance advantages across all corporate departments by fundamentally restructuring how teams allocate their focus.
On one hand, it redirects high-value employee hours toward core business strategy. Highly compensated analysts should not spend their working afternoons modifying chart margins or adjusting color legends manually. By running an intuitive chart gen ai, the entire visualization stack condenses from an afternoon of troubleshooting into a quick thirty-second conversation. Consequently, teams can focus ninety-five percent of their energy on studying competitor trends and executing growth campaigns.
On the other hand, it democratizes reporting capabilities across different business units. Traditional business intelligence tools often feature steep technical barriers, limiting report creation to specialized data science teams. A conversational interface removes these technical barriers completely. Whether it is an operations intern with no data background or a busy executive running multiple brands, any team member can build professional visual reviews independently just by typing a sentence.
Business Intelligence Growth and Scalability
Raw corporate metrics carry no practical value until they translate into accessible visual insights. Traditional spreadsheet reporting workflows place a heavy time tax on internal operations, wasting valuable company hours on manual table formatting and troubleshooting broken cell ranges.
By deploying a dedicated chart gen ai, modern organizations eliminate administrative friction and protect their operational velocity. This simple workflow shift does more than raise administrative efficiency; it builds a highly responsive operational structure equipped to execute strategic decisions at the speed of real-time market data. Embracing conversational analytics is no longer just a shortcut; it is the definitive future of business intelligence.