



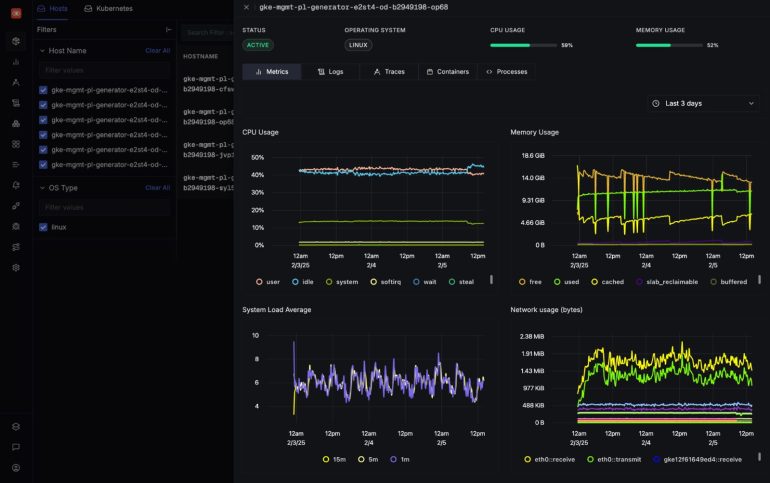
Monitoring means continuously checking the health of the time series database, collectors, query services, alerting engine, and notification channels that provide operational visibility. Without independent health checks, a monitoring failure can hide infrastructure incidents, delay alerts, create gaps in historical data, and leave engineers troubleshooting without reliable evidence.
What Is Monitoring of Monitoring?
A monitoring system observes applications, servers, networks, databases, and cloud infrastructure. Monitoring of monitoring adds another layer that evaluates whether the monitoring platform itself is working correctly.
This layer should confirm that:
- Collectors are scraping or receiving telemetry.
- Samples are reaching the time series database.
- The database is storing data successfully.
- Queries are completing within acceptable latency.
- Dashboards are receiving complete results.
- Alerting rules are being evaluated on schedule.
- Notifications are reaching the intended channels.
- Backups and recovery processes are functioning.
- Capacity remains available for workload growth and failures.
VictoriaMetrics components expose internal metrics in Prometheus-compatible format through their /metrics endpoints. VictoriaMetrics also provides official Grafana dashboards that can be used to review component health.
However, simply collecting these metrics is not enough. Teams must define warning thresholds, test alert delivery, and ensure that health data remains accessible when the primary monitoring system is unavailable.
What Happens When the Monitoring System Fails?
A monitoring failure does not necessarily stop the applications being monitored. It removes the organization’s ability to see what those applications are doing.
The consequences may include:
- Infrastructure incidents continuing without alerts
- Missing or delayed telemetry
- Empty or incomplete dashboards
- Failed alert evaluations
- Partial query results
- Inability to investigate an outage
- Lost historical evidence
- Delayed incident response
- Incorrect capacity-planning decisions
- False confidence that systems are healthy
The most dangerous failure mode is silent failure. A dashboard may continue loading while its newest data is several minutes old. An alerting service may still be running while rule evaluations are failing. A collector may remain online while its remote-write queue continues growing.
For that reason, monitoring health should be evaluated through freshness, completeness, latency, and delivery—not only whether a process is running.
How Do I Monitor a Time Series Database?
Start by monitoring the full path followed by telemetry:
- The application or exporter generates metrics.
- A collector scrapes or receives them.
- The collector forwards them to the TSDB.
- The TSDB indexes and stores the samples.
- Query services retrieve the data.
- Dashboards display the results.
- The alerting engine evaluates rules.
- The notification service delivers alerts.
A failure at any point can reduce visibility.
A practical time series monitoring strategy should cover ingestion, storage, queries, cardinality, resources, alerting, and external availability.
Which Metrics Indicate That a TSDB Is Overloaded?
No single metric proves that a time series database is overloaded. Teams should look for several related signals.
Ingestion Health
Monitor:
- Samples received per second
- Samples successfully written
- Rejected or dropped samples
- Failed write requests
- Remote-write retries
- Collector queue growth
- Ingestion latency
- Percentage of slow inserts
- Delay between sample timestamp and storage time
In VictoriaMetrics, a high percentage of slow inserts may indicate that information about active series no longer fits efficiently in memory. This condition can increase disk I/O and CPU usage while slowing ingestion.
A rising ingestion queue is an early warning even when no samples have been dropped. It indicates that the collector is producing data faster than the destination can accept it.
Query Performance
Monitor:
- Median query latency
- 95th- and 99th-percentile query latency
- Query errors
- Query timeouts
- Cancelled queries
- Concurrent queries
- Queueing time
- Slow dashboard panels
- Partial query results
Average latency can hide short periods of severe degradation. A platform may appear healthy overall while expensive historical queries or high-cardinality dashboards are timing out.
Test query performance while ingestion is at its normal peak. Query and ingestion workloads compete for CPU, memory, disk, and network resources.
CPU, Memory and Disk
Monitor:
- CPU utilization
- Memory consumption
- Cache efficiency
- Disk utilization
- Available disk space
- Disk read and write latency
- Storage growth
- Network throughput
- Errors between cluster components
VictoriaMetrics troubleshooting guidance notes that consistently high CPU can indicate an overloaded cluster. Short CPU spikes may also cause transient failures even when normal scrape intervals do not capture them clearly.
VictoriaMetrics recommends keeping at least 20% of storage free so that compression and storage operations can continue efficiently.
Alert before a disk becomes nearly full. Waiting until only a small amount of capacity remains can make recovery more difficult and increase the risk of failed writes.
Cardinality and Churn
Monitor:
- Active time series
- New series created per hour
- New series created per day
- Series churn rate
- Index growth
- Labels with the most unique values
- Metrics generating the most series
- Memory used for active-series tracking
High cardinality can increase memory use and slow inserts. High churn continuously adds new series to the index and may slow queries across longer time ranges. VictoriaMetrics recommends identifying frequently changing labels with tools such as Cardinality Explorer and reducing or pre-aggregating unnecessary dimensions.
How Can I Detect Monitoring Problems Before Dashboards Fail?
Dashboards are usually a late indicator. By the time users report slow or empty panels, ingestion queues, query latency, or storage pressure may have been increasing for hours.
Create early-warning alerts for:
- Increasing remote-write queue size
- Repeated write retries
- A rising percentage of slow inserts
- Rapid active-series growth
- Unexpected churn
- Sustained CPU pressure
- Falling free disk space
- Increased disk latency
- Query latency exceeding normal baselines
- Alerting-rule evaluation delays
- Notification delivery failures
- Missing data from expected targets
- Network errors between TSDB components
Use three alert levels.
Warning
Trigger a warning when the system is still functioning but is moving away from its normal baseline.
Examples include:
- Storage growth is faster than forecast.
- Query latency has doubled from its normal level.
- Cardinality is increasing unusually quickly.
- Collector queues are growing but remain manageable.
Urgent
Trigger an urgent alert when performance is degrading and intervention is required.
Examples include:
- Write retries continue increasing.
- Query timeouts are appearing.
- Available disk space is approaching the operational threshold.
- A cluster component is unavailable.
- Rule evaluations are falling behind schedule.
Critical
Trigger a critical alert when visibility or data availability is already affected.
Examples include:
- Samples are being dropped.
- The TSDB rejects writes.
- Dashboards return incomplete data.
- Alert evaluations fail.
- Notifications cannot be delivered.
- The platform cannot tolerate another component failure.
Do Not Store Every Health Signal Only in the System It Monitors
A TSDB cannot reliably report its own failure after it becomes unavailable.
For critical environments, send a small set of essential health metrics to an independent destination. This may be:
- A separate monitoring cluster
- A managed external service
- A lightweight secondary TSDB
- An independent uptime checker
- A separate cloud account or region
At minimum, the independent path should track:
- TSDB availability
- Successful ingestion
- Data freshness
- Query success
- Disk capacity
- Alerting-service health
- Notification delivery
The independent system does not need to store every infrastructure metric. Its purpose is to confirm that the primary monitoring platform is alive and trustworthy.
Collectors such as vmagent can replicate metrics to multiple Prometheus-compatible remote storage destinations and buffer data on disk during remote-storage outages.
How Should Alert Delivery Be Tested?
An alert is not complete until a person or incident-management system receives it.
Test the full path:
- Metric generation
- Collection
- Storage
- Rule evaluation
- Alert state change
- Notification routing
- Email, Slack, PagerDuty, or webhook delivery
- Acknowledgment by the receiving team
Create a scheduled test alert and confirm that it reaches the expected destination. Record delivery time and investigate unexpected delays.
Also monitor the alerting system for:
- Failed rule evaluations
- Long evaluation durations
- Missed evaluation intervals
- Notification errors
- Repeated retries
- Misconfigured routing
- Expired credentials
- Disabled integrations
Self-Hosted, Managed or Independent Expert Monitoring?
Self-Hosted Monitoring May Be Appropriate When:
- The organization has experienced platform engineers.
- Infrastructure-level control is required.
- Data must remain within a specific environment.
- The team can maintain dashboards, alerts, upgrades, and backups.
- Independent monitoring can be deployed separately.
VictoriaMetrics’ open-source offering provides scalable time-series storage, Prometheus compatibility, long-term retention, and a relatively low operational footprint.
Cloud Monitoring May Be Appropriate When:
- The team wants to reduce infrastructure maintenance.
- Rapid deployment and scaling are priorities.
- Managed upgrades and backups are valuable.
- Internal platform-engineering capacity is limited.
Use the final VictoriaMetrics Cloud URL rather than the redirected /products/managed/ address. VictoriaMetrics Cloud provides managed single-node and cluster deployments and can be used as a managed Prometheus-compatible backend.
Monitoring of Monitoring May Be Appropriate When:
- The monitoring platform is business-critical.
- The internal team wants expert review of its health metrics.
- Problems should be identified before they affect infrastructure visibility.
- Additional guidance on performance and optimization is required.
VictoriaMetrics’ Monitoring of Monitoring service analyzes health metrics generated by VictoriaMetrics components and can notify teams through channels including email, Slack, and PagerDuty. The service monitors platform health data rather than customers’ personal or business data.
A Representative Monitoring Failure Scenario
Consider a platform ingesting metrics from several Kubernetes clusters.
At first, dashboards continue working normally. However:
- A deployment process creates rapidly changing pod labels.
- Active-series churn increases.
- The index grows faster than forecast.
- Slow inserts increase.
- CPU and disk I/O rise.
- Remote-write queues begin growing.
- Query latency becomes inconsistent.
- Alert evaluations start completing late.
A basic availability check may still report that the TSDB is online. A properly designed database monitoring strategy would detect the rising churn, slow inserts, resource pressure, and evaluation delays before dashboards become unavailable.
The permanent correction may involve removing unnecessary labels, applying cardinality controls, increasing capacity, and reviewing alert thresholds. Simply restarting the database would not address the underlying cause.
Monitoring-of-Monitoring Checklist
Use this checklist to review your current setup:
- All TSDB components expose health metrics.
- Official or equivalent dashboards are installed.
- Ingestion success and failure rates are monitored.
- Collector queues and retries are monitored.
- Data freshness is measured.
- Query latency is tracked at multiple percentiles.
- Active series and churn are monitored.
- Free disk space has an early-warning threshold.
- CPU, memory, disk, and network usage are monitored.
- Alerting-rule evaluation health is visible.
- Notification delivery is tested regularly.
- Critical health signals are stored independently.
- Backups are created and restoration is tested.
- Failure scenarios are included in capacity planning.
- Each alert has a documented owner and response action.
Frequently Asked Questions
How do I monitor a time series database?
Collect the TSDB’s internal metrics, install health dashboards, define alerts for ingestion, query performance, storage, cardinality, and resources, and keep critical health checks outside the primary system.
What happens when the monitoring system fails?
Teams may lose alerts, dashboards, historical evidence, and the ability to diagnose infrastructure incidents. Silent failures can be especially dangerous because the platform may appear available while its data is stale or incomplete.
Which metrics show that a TSDB is overloaded?
Important indicators include slow inserts, write retries, queue growth, query latency, timeouts, high CPU, memory pressure, disk latency, low free storage, rapidly increasing cardinality, and network errors.
How can I detect monitoring problems before dashboards fail?
Alert on leading indicators such as ingestion backlog, cardinality growth, slow inserts, disk pressure, delayed alert evaluations, and abnormal query latency rather than waiting for complete service failure.
What is monitoring of monitoring?
It is the process of monitoring the availability, performance, capacity, and data quality of the monitoring platform itself.
Should monitoring health data be stored separately?
Critical health signals should have an independent path so teams can investigate when the primary TSDB is unavailable.
Make the Monitoring System Observable
A reliable monitoring solution should reveal its own capacity limits, failures, delays, and data-quality problems before users lose visibility.
Monitoring the monitoring system requires more than an uptime check. It requires early-warning metrics, independent verification, tested alert delivery, capacity headroom, and clear operational ownership.
VictoriaMetrics offers open-source, enterprise, cloud, and monitoring options for teams that need scalable time-series storage and dependable operational visibility.